Map Basics
This is part of the Navigate series of modules.
Map Basics
Scroll down to learn the basics of Maps or hit the Navigate button to return to the Navigate landing page.
Why carry a map?
Picture yourself in the middle of open countryside, no street signs, nobody to ask, to your left there is a lake and ahead of you a forest. Even with such little information, a map can help you work out where you are.
or put it another way … without a map, you may as well start guessing.
Ordnance Survey
using the right kind of map could be the difference between life and death, an A-Z Streetmap is useless when you are in the middle of the countryside.
Ordnance Survey (OS) is the national mapping agency for Great Britain. The agency’s name indicates its original military purpose (see ordnance and surveying), which was to map Scotland in the wake of the Jacobite rising of 1745. There was also a more general and nationwide need in light of the potential threat of invasion during the Napoleonic Wars. Since 1 April 2015 Ordnance Survey has operated as Ordnance Survey Ltd, a government-owned company, 100% in public ownership. The Ordnance Survey Board remains accountable to the Secretary of State for Business, Energy and Industrial Strategy. It was also a member of the Public Data Group.
Paper maps for walkers represent only 5% of OS’ annual revenue. They produce digital map data, online route planning and sharing services and mobile apps, plus many other location-based products for business, government and consumers. Ordnance Survey mapping is usually classified as either “large-scale” (in other words, more detailed) or “small-scale”. The Survey’s large-scale mapping comprises 1:2,500 maps for urban areas and 1:10,000 more generally. (The latter superseded the 1:10,560 “six inches to the mile” scale in the 1950s.) These large scale maps are typically used in professional land-use contexts and were available as sheets until the 1980s, when they were digitised. Small-scale mapping for leisure use includes the 1:25,000 “Explorer” series, the 1:50,000 “Landranger” series and the 1:250,000 road maps.
Symbols are the Key
To the uninitiated, maps are simply lots of lines and funny little symbols, to those in the know, maps are incredibly detailed and useful representations of the geography around us.
Understanding what each type of line and each symbol represents is the first hurdle to overcome.
During this module, we will primarily focus on OS Explorer Maps (1:25,000) but will also mention OS Land Ranger Maps (1:50,000). Which type of map is right for you is discussed below.
OS Explorer Maps (1:25,000)
OS Explorer maps are usually the choice for ramblers and explorers who need to see greater detail on their map. The clue is in the map ratio, in this case 1:25,000.
Imagine you are a bird flying at 25 feet above the ground, you may not be able to see very far but what you can see, is great in detail. What the ration means in reality is that every 1cm of map represents 25,000cm (or 250 metres) of real land.
Learn the symbols
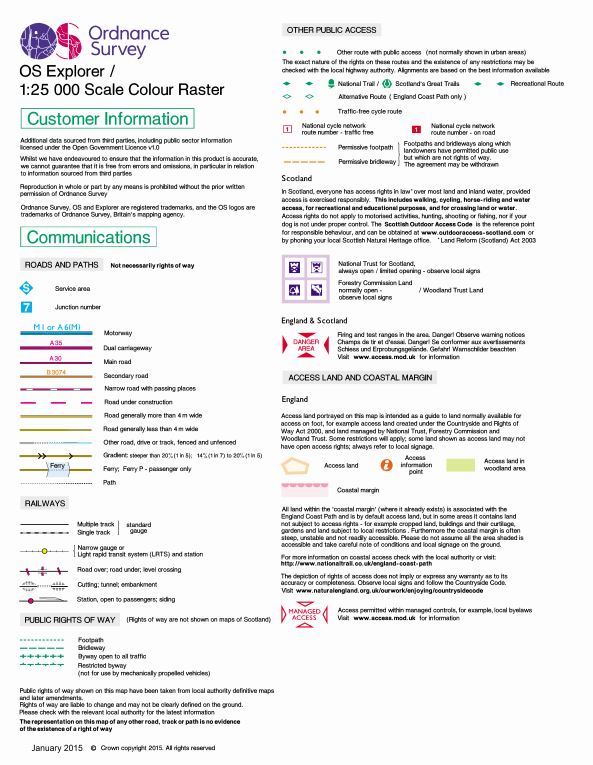
Index of Symbols
This is a handy 2 page index of all the most common symbols that you are likely to see on an OS Explorer Map.
Flashcards
Remembering those symbols may be the difference in trekking miles to a Footbridge thinking you had found somewhere with Facebook access.
OS Land Ranger Maps (1:50,000)
OS Land Ranger maps are usually the choice for people who need to see a greater distance with less detail on their map. The clue is in the map ratio, in this case 1:50,000.
Imagine you are a bird flying at 50 feet above the ground, you would see further than a bird flying at 25 feet but you would not see as much detail. What the ration means in reality is that every 1cm of map represents 50,000cm (or 500 metres) of real land.
Learn the symbols
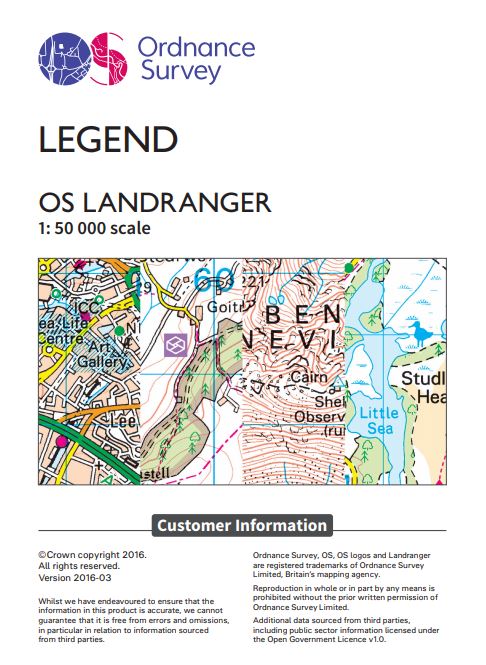
Index of Symbols
This is a handy 4 page index of all the most common symbols that you are likely to see on an OS Land Ranger Map.
Flashcards
Remembering those symbols be the difference in trekking miles to a toilet thinking you had found somewhere with computers.
Grid References
I’ll say it now so you don’t forget … X is a cross, Y’s up … in alphabetical order … which comes first?
Everything is on the grid
Every square centimetre of the United Kingdom can be referenced on an Ordnance Survey map, if you had a big enough piece of paper, you could get the whole of the UK on one map and there would be no confusion because every square kilometre has a unique reference.
But of course we couldn’t hope to have a piece of paper so large that we could see every picnic area, every camp site or every public toilet. So, the whole country has been broken down into a number of maps (429 OS Explorer Maps and/or 219 OS Land Ranger Maps).
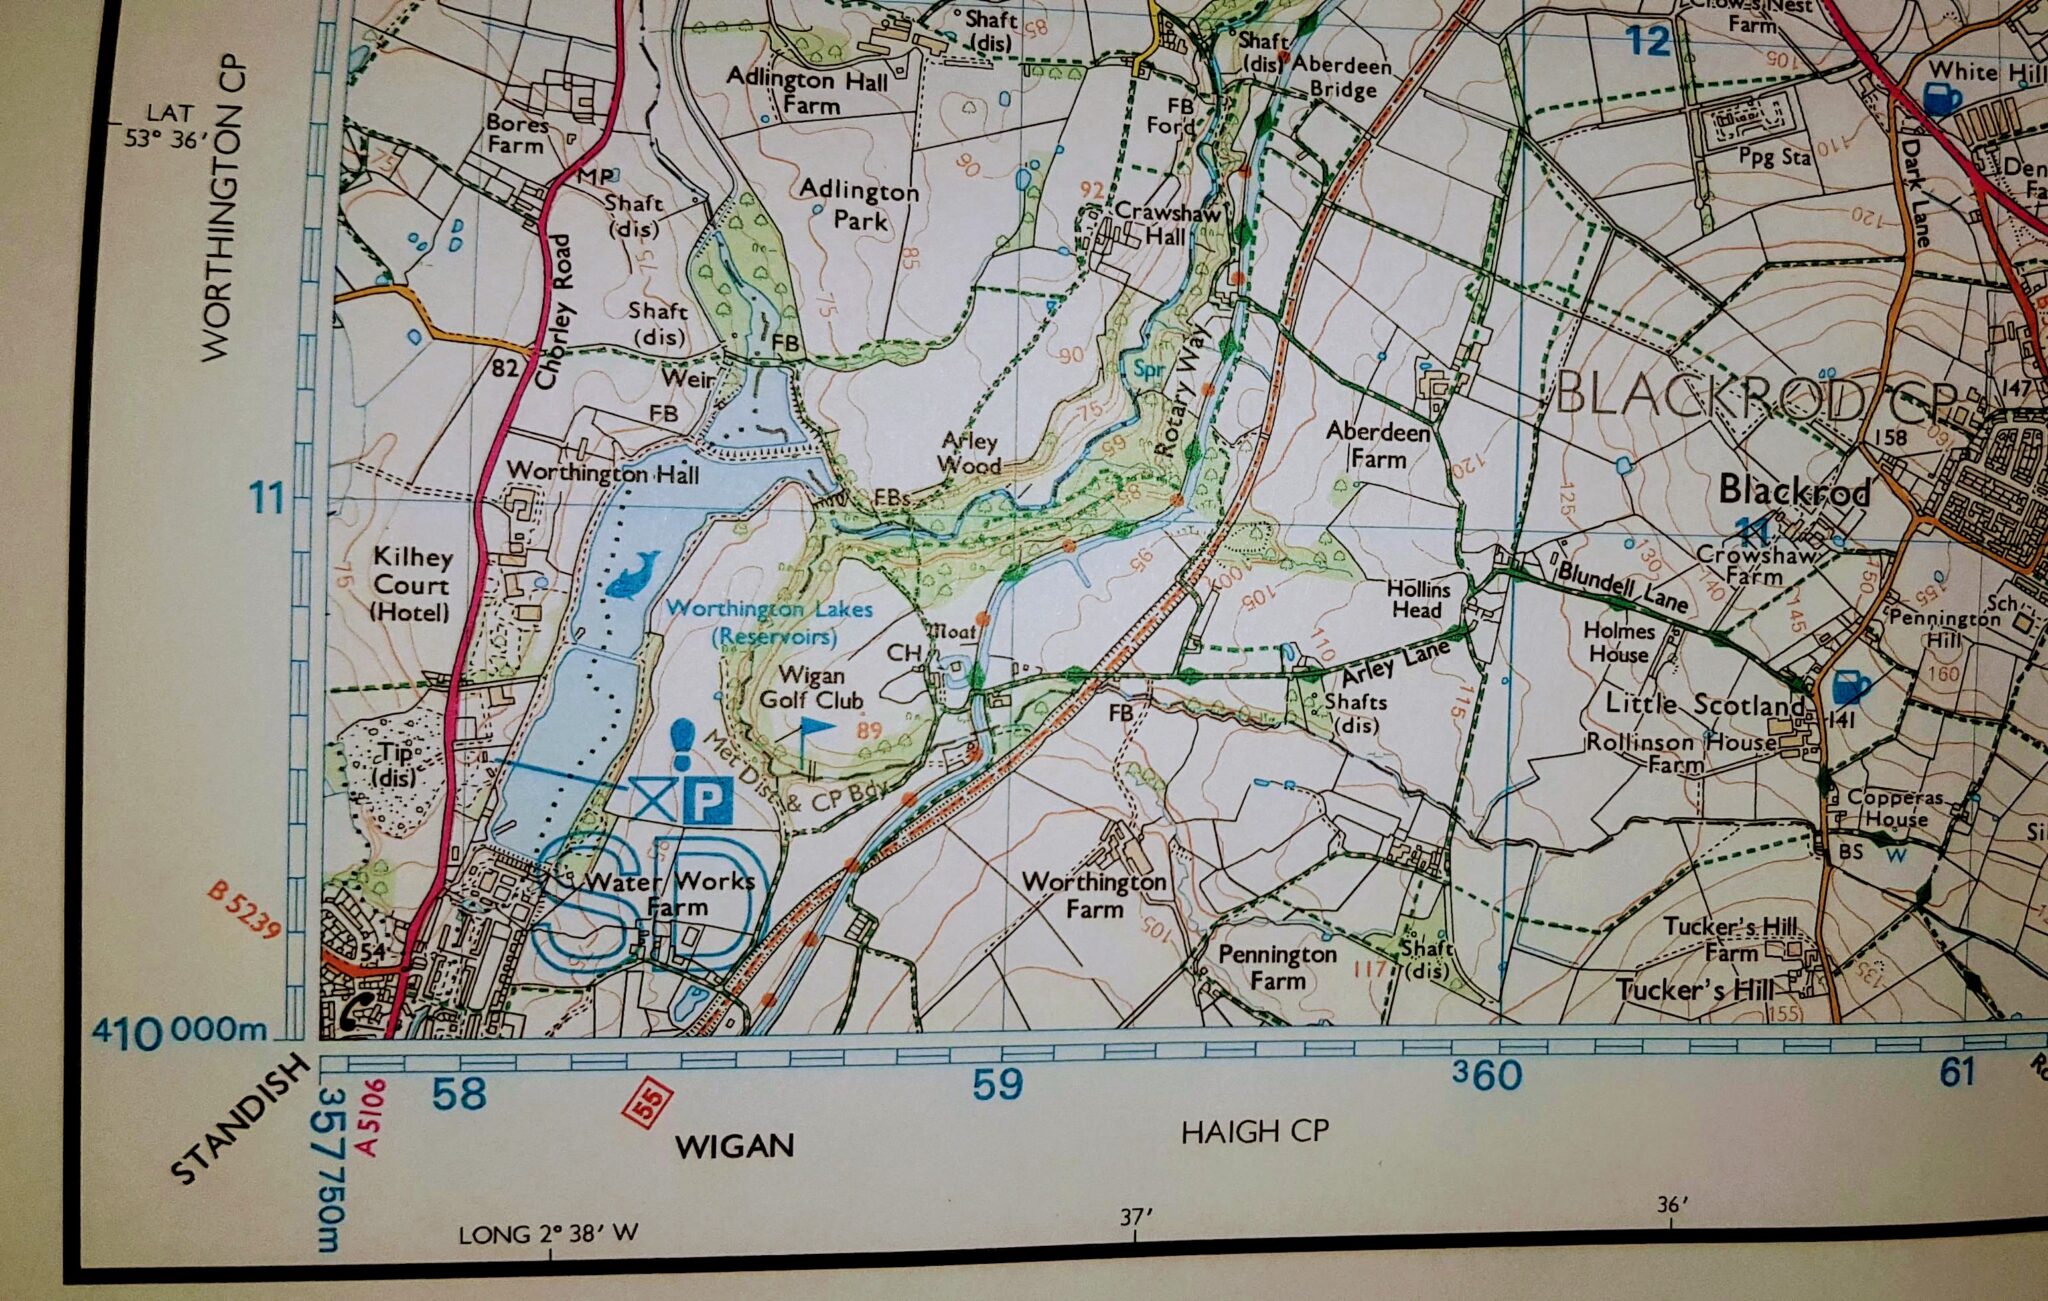
For reference, in this module, I will be using OS Explorer Map 287 (West Pennine Moors) … which covers the area of the Pike View Hike.
Eastings
Running along the bottom (and Top) edge of every OS Map you will discover the X coordinates (or Eastings … due to the fact that they always head in an Easterly direction).
On OS Explorer map 287 these run from 58 to 80 (numbers less than 58 will appear on maps to the west of map 287, numbers greater than 80 will appear on maps to the East of map 287).
** The numbers actually run from 358 to 380 but as these are all within the 300 range then we can ignore that at local level.
Each number is associated with a vertical gridline, on the map these are 4cm apart, in reality they represent invisible North-South lines which are 1km apart.
Northings
Running along the left (and Right) edge of every OS Map you will discover the Y coordinates (or Northings … due to the fact that they always head in a Northerly direction).
On OS Explorer map 287 these run from 10 to 40 (numbers less than 10 will appear on maps to the South of map 287, numbers greater than 40 will appear on maps to the North of map 287).
** The numbers actually run from 410 to 440 but as these are all within the 400 range then we can ignore that at local level.
Each number is associated with a horizontal gridline, on the map these are 4cm apart, in reality they represent invisible East-West lines which are 1km apart.
So Map 287 actually represents an area 21km wide and 29km tall.
4 Digit Grid References
A 4 digit grid reference is simply made up of the 2 Eastings and the 2 Northings, meaning that the 4 digit grid reference on OS Explorer Map 287 of 5810 actually refers to the entire grid or cell to the right of the 58 Easting and the entire grid or cell above the 10 Northing. Therefore a 4 digit grid reference refers to a 1km x 1km area of a map.
** Notice that we always refer to the X coordinate first followed by the Y coordinate (X is a cross, Y’s up and X comes before Y in the alphabet) this is sometimes referred to as going along the corridor before going up the stairs.
6 Digit Grid References
Although 4 Digit Grid References are very easy to use, they are rarely used due to the fact that they can only reference a 1km square cell, which although useful for general navigation, it is of little use when trying to find a specific object.
To reference a more specific point on a map, we increase the number of digits used for both the Eastings and the Nothings, so instead of using 2 digits for each, we use 3 digits for each.
But where do we get an extra digit from?
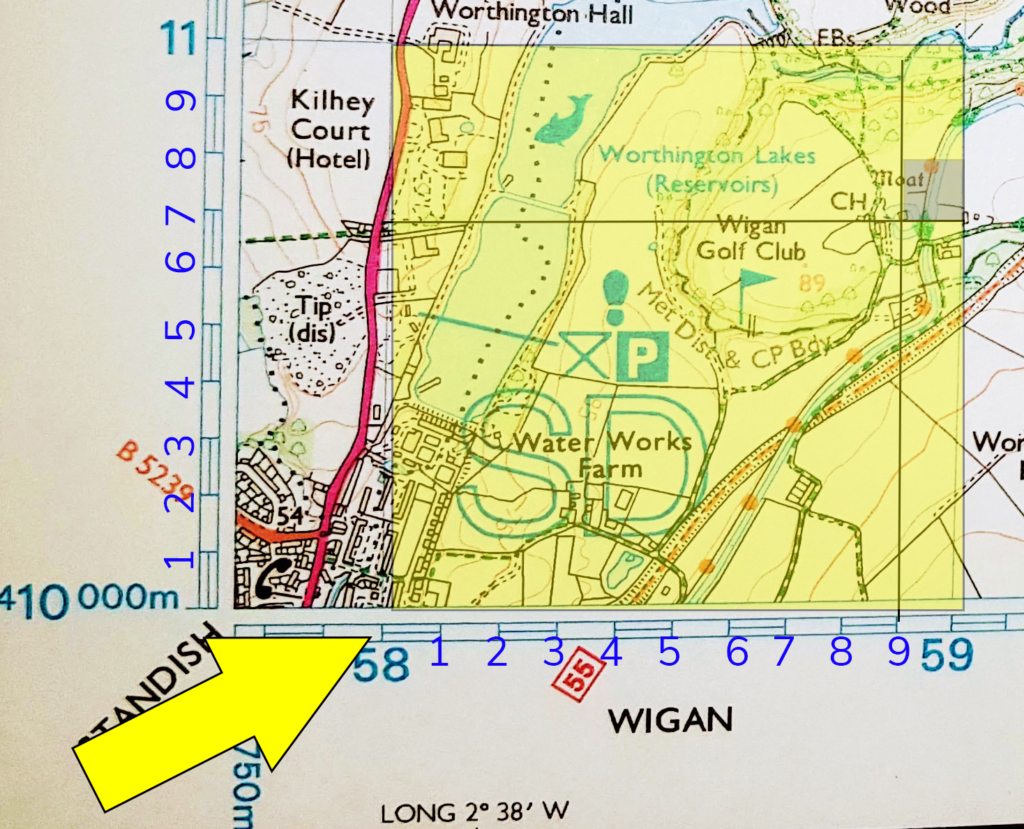
Take a look at the image to the right, notice that alongside of the 58, there are 10 alternating markers leading to the 59. (I have numbered these 1 – 9)
You can see a similar example on the Northings leading from 10 up to 11.
Each of these markers represents 100 metres … or 1/10th of each grid square on the map.
you will also notice that I have used these imaginary numbers to highlight a 100m x 100m square.
To specify the Grid reference of this square, we use the same principle as we did with 4 digit references (XXYY) but we now tag the imaginary number onto each pairing (XX1YY2) … so the small square on the right would be represented as 589107.
8 Digit Grid References and beyond
Many People insist that 6 Digit grid references are specific enough … and they are probably right … 100m x 100m is the approximate width of a football pitch squared, if you cannot find the campsite or car park in a 100m square then there is something wrong but imagine we were looking for buried treasure, I’m sure you wouldn’t want to dig a 100m wide hole in the ground?
We may then choose to use 8 Digit Grid References (10m x 10m) … or if we really were looking for buried treasure then 10 Digit Grid References would be preferable … however using the naked eye to be so specific is not without error, of course digital mapping software is quite capable of giving very precise coordinates but the person using the paper map needs to be equally precise.
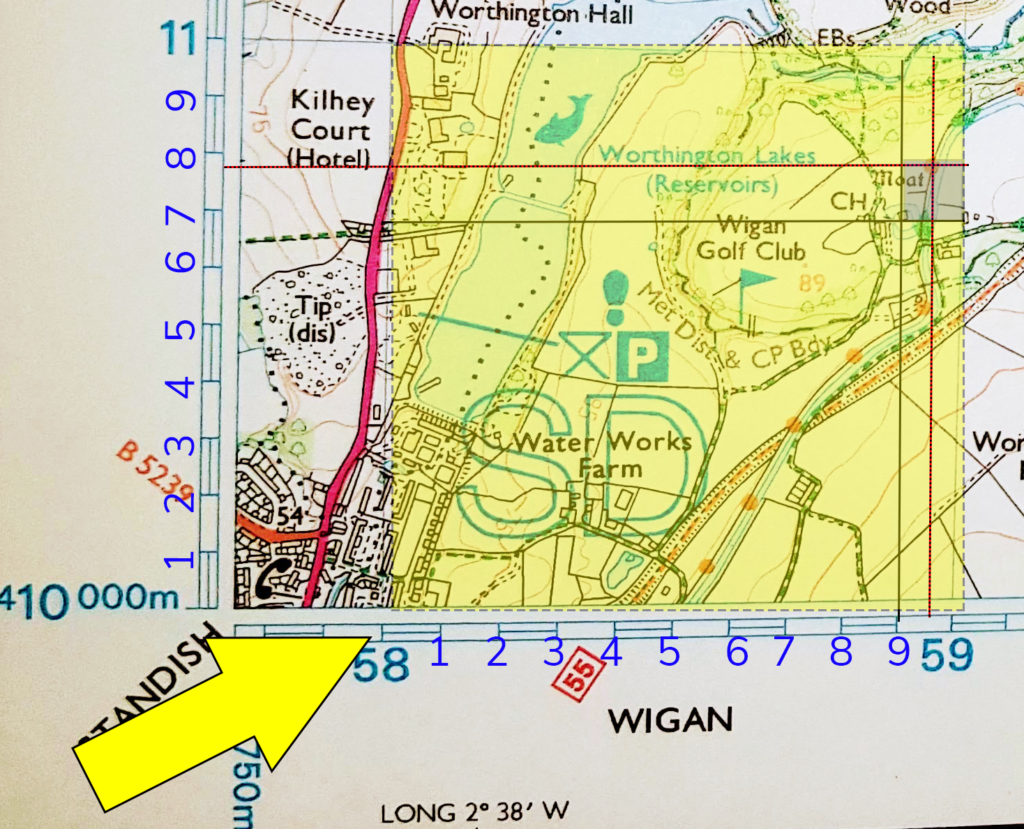
8 Digit Grid References are not uncommon though, so for completeness, I have added 2 additional lines to the image on the left which would be approximately represented as 5895 1079 (note that I have added a space just to make the 8 digit number easier to read).
Contours
Contours quite literally add an extra dimension to your maps.
Contours give depth
In the last lesson, we learned how grid references give lateral precision to a map, however unlike a map, the World is not flat, we have hills and valleys that we need to be aware of unless we like energy sapping surprises.
Due to the fact that a typical OS Map is often filled with contour lines, we often don’t notice them … and yet they are so crucial when it comes to planning any journey.
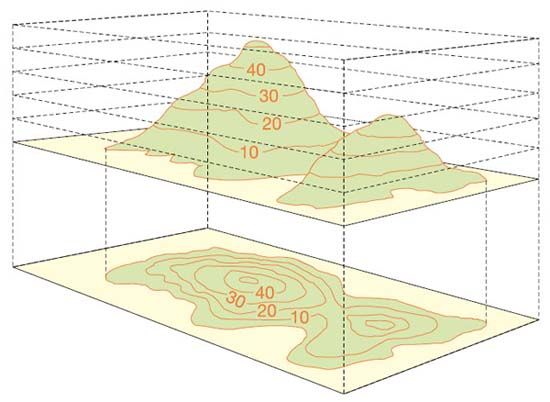
Typically, contour lines are at 5 metre intervals though will often be shown in 10 metre intervals when the terrain is particularly hilly or mountainous. Notice that when the terrain is steeper, the contour lines are closer together as obviously the 5/10 m increments are reached more quickly.
Heights are in metres above Sea Level, this needs to be considered when planning a journey as your starting point will not always be from 0m above Sea Level.
Hills or valley's
Occasionally, you may lose track of the number representing the height and this can lead you to mistake a hill for a valley which are often the same shape. One golden rule to keep in mind is that water tends to always flow down so look out for lakes and multiple rivers joining into one … rivers will often combine the lower the get.
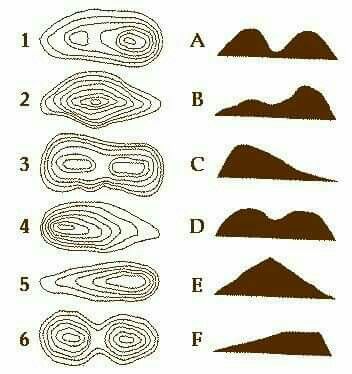
Exercise
Take a look at the 6 contours and the 6 profile views … see if you can match all contours to profiles.
1 – B
2 – E
3 – D
4 – C
5 – F
6 – A